
Contact us
This approach aims to unveil intricate signaling networks between different cell types and the extracellular matrix (ECM) in the 3D tumor microenvironment (TIME) using two FFPE gynecologic tumor samples (HGSOC & AEH).
Stereo-seq for FFPE enabled the capture of not only human coding and non-coding RNA but also microbiome RNAs with subcellular resolution.
The Innomics’ Stereo-seq FFPE technology was employed by a research team at the University of Texas MD Anderson Cancer Center in their study titled "Molecular, Metabolic, and Subcellular Mapping of the Tumor Immune Microenvironment via 3D Targeted and Non-Targeted Multiplex Multi-Omics Analysis," which was published in the Cancers journal.
The team presents a novel pipeline for constructing a 3D spatial atlas with subcellular resolution by integrating Stereo-seq FFPE technology, mass spectrometry imaging (MSI), and multiplex sequential immunofluorescence (seqIF) using two formalin-fixed paraffin-embedded (FFPE) tumor samples (HGSOC & AEH).
Figure 1. Schematic diagram summarizing the 3D targeted and non-targeted multiplexed multi-omics workflow used to dissect the tumor immune microenvironment.
Utilizing this atlas, the researchers have successfully elucidated cellular identity, activation, and energized status. They demonstrated distinct profiles of analytes expressed by cancer cells and their neighboring counterparts in different regions of the tumor tissue. By employing a diverse array of spatial omics detection methodologies, the inherent limitations of individual techniques can be overcome, thereby facilitating the construction of an authentic and comprehensive spatial map. This pipeline holds promise for its application in large patient cohorts to uncover novel predictive and prognostic biomarkers with spatial resolution, which could potentially inform the development of innovative therapeutic agents and strategies in cancer treatment.
This study uses a novel version of the STOmics pipeline (Stereo-seq N transcriptomics chips, 1 cm×1 cm, FFPE) to generate spatially resolved transcriptomic profiles from three FFPE sections derived from HGSOC and AEH samples. Stereo-seq FFPE technique possesses multiple advantages:
1. Stereo-seq captured the mean gene type counts, ranging on average from 60 to 100 per 100 µm2 (bin size: 20, 10 µm × 10 µm), in HGSOC and AEH samples.
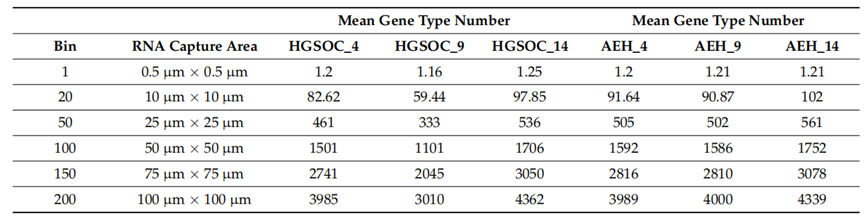
Table 1. Mean gene type number per bin with different bin size.
2. The Stereo-seq analysis revealed no significant batch effect across the three layers of the same tumor tissue sample, and the clustering results exhibited consistent patterns.
Figure 2. UMAPs generated after Stereo-seq analysis for HGSOC sample.
3. The application of Stereo-seq also facilitated the characterization of spatial transcriptomes of microorganisms residing within the same tissue sections, unveiling a diverse array of bacteria, fungi, and viruses.

Figure 3. Stereo‐seq non‐host spatial transcriptomics results for HGSOC sample.


